


Next: Developement of a New
Up: Methods to Calculate Astronomical
Previous: Air Mass And Wavelength
Index
Seeing is caused by turbulent cells in the atmosphere as it is analysed in previous paragraphs. According to the Kolmogorov theory, these cells come in various sizes. Thus, the turbulence-induced phase fluctuation occur at various frequencies, mainly depending on the size of the cells and the windspeed. The important question to be addressed is whether differential image motion measurements probe the complete frequency power spectrum of the seeing: The images have to ``freeze'' the image motion, i.e. the exposure time of the images has to be sufficiently lower than the time needed for the air cell to move across the line of sight. If this is not the case, then the seeing caused by the high part of the frequency power spectrum is not measured since high-frequency contributions to the differential image motion are averaged out.
It is thought that much of the seeing is caused by phase fluctuations with frequencies less than a  . Therefore, an exposure time of
  should suffice to obtain seeing measurements using differential image motion. Since there is a contribution of phase fluctuation with frequencies between
  and 100Hz, it is likely that there is also a contribution with frequencies above . the problem is that is the smallest possible exposure time (for technical reasons), so we cannot probe this part of the spectrum. However, considering how well-behaved the power spectrum is up to , one can expect that it is easily possible to scale the seeing measurements of the Dimm to the real seeing by using a single scaling factor.
The temporal averaging of the variance of the differential motion with a finite exposure time  depends both on the average velocity
  and on the direction of the displacement of the wavefront corrugations with respect to the DIMM apertures. The exact computation of this effect (Martin et al.,1987) for a typical experimental setup (distance of the apertures equal to twice their diameter
  ) and typical operating conditions (
 ) shows that the differential tilt variance
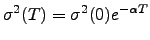
  presents in all cases an exponential dependency on the exposure time of the type :
 |
(3.20) |
where the coefficient  is of course unknown and depends on atmospheric conditions. However, performing two simultaneous measurements with exposure times
  and
and  such that
 , the coefficient can be eliminated and the bias can be removed by computing :
![$\displaystyle \sigma^2(0)=\frac{\big[\sigma^2(T_1)\big]^2}{\sigma^2(T_2)}$](img170.png) |
(3.21) |
In practice the two variances are calculated over two interlaced time series (Sarazin, 1997) or, when possible, on a single time series by rebinning the individual exposures (Ziad et al., 2000). The amount of correction is naturally site-dependent but often not to be neglected. It was noted by Giovanelli et al. (2001) that, at the northern Chile high-altitude sites, the median values of the 0 ms seeing vary between  and
and  arcsec, those of the
  ms seeing between
  and arcsec while those of the
  ms seeing between
  and arcsec.
Next: Developement of a New
Up: Methods to Calculate Astronomical
Previous: Air Mass And Wavelength
Index