Section of
ASTROPHYSICS,
ASTRONOMY
& MECHANICS
Aristotle University
of Thessaloniki
Physics Department


Whether you are an individual, a group, a school or an amateur astronomer you can be part of this project! Send us an email and express your interest in the following address: exoworlds.spies@gmail.com
Below, the figures are provided to give you an idea of the data we obtain and the results that we want to achieve.
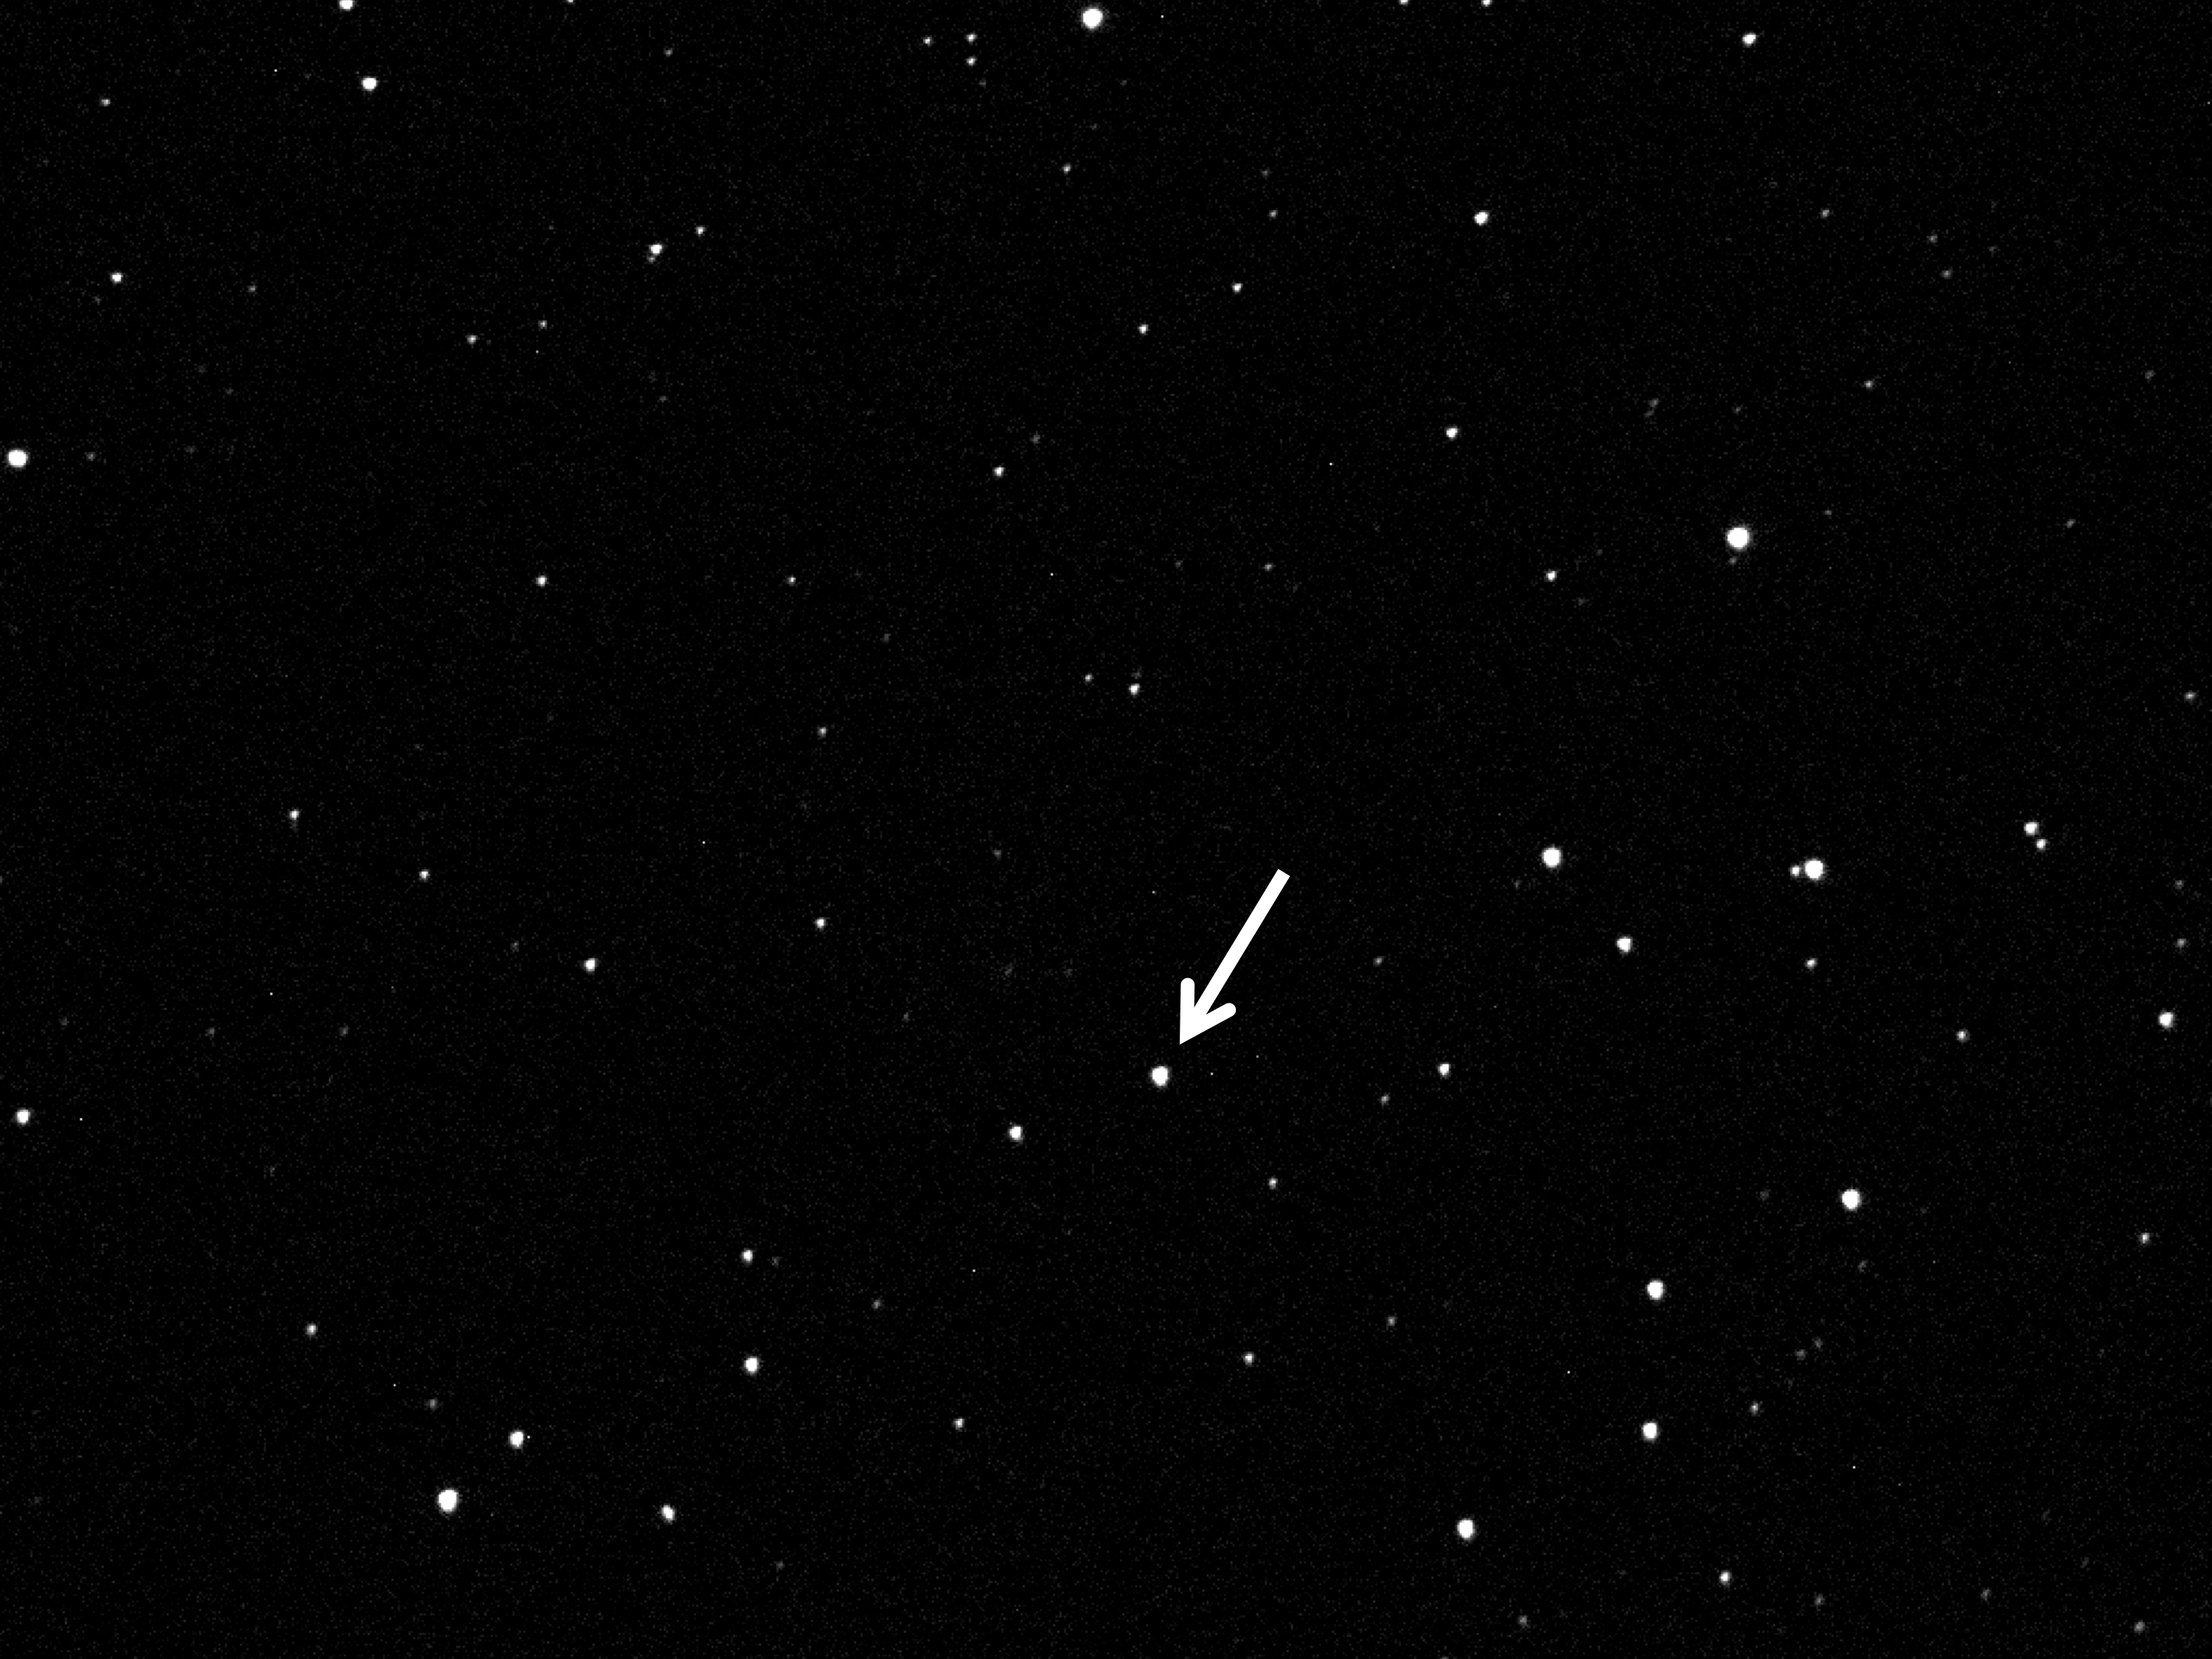
1. How does the host star look like with a telescope?
The picture below is an example of the star WASP-10 which hosts the exoplanet WASP-10b
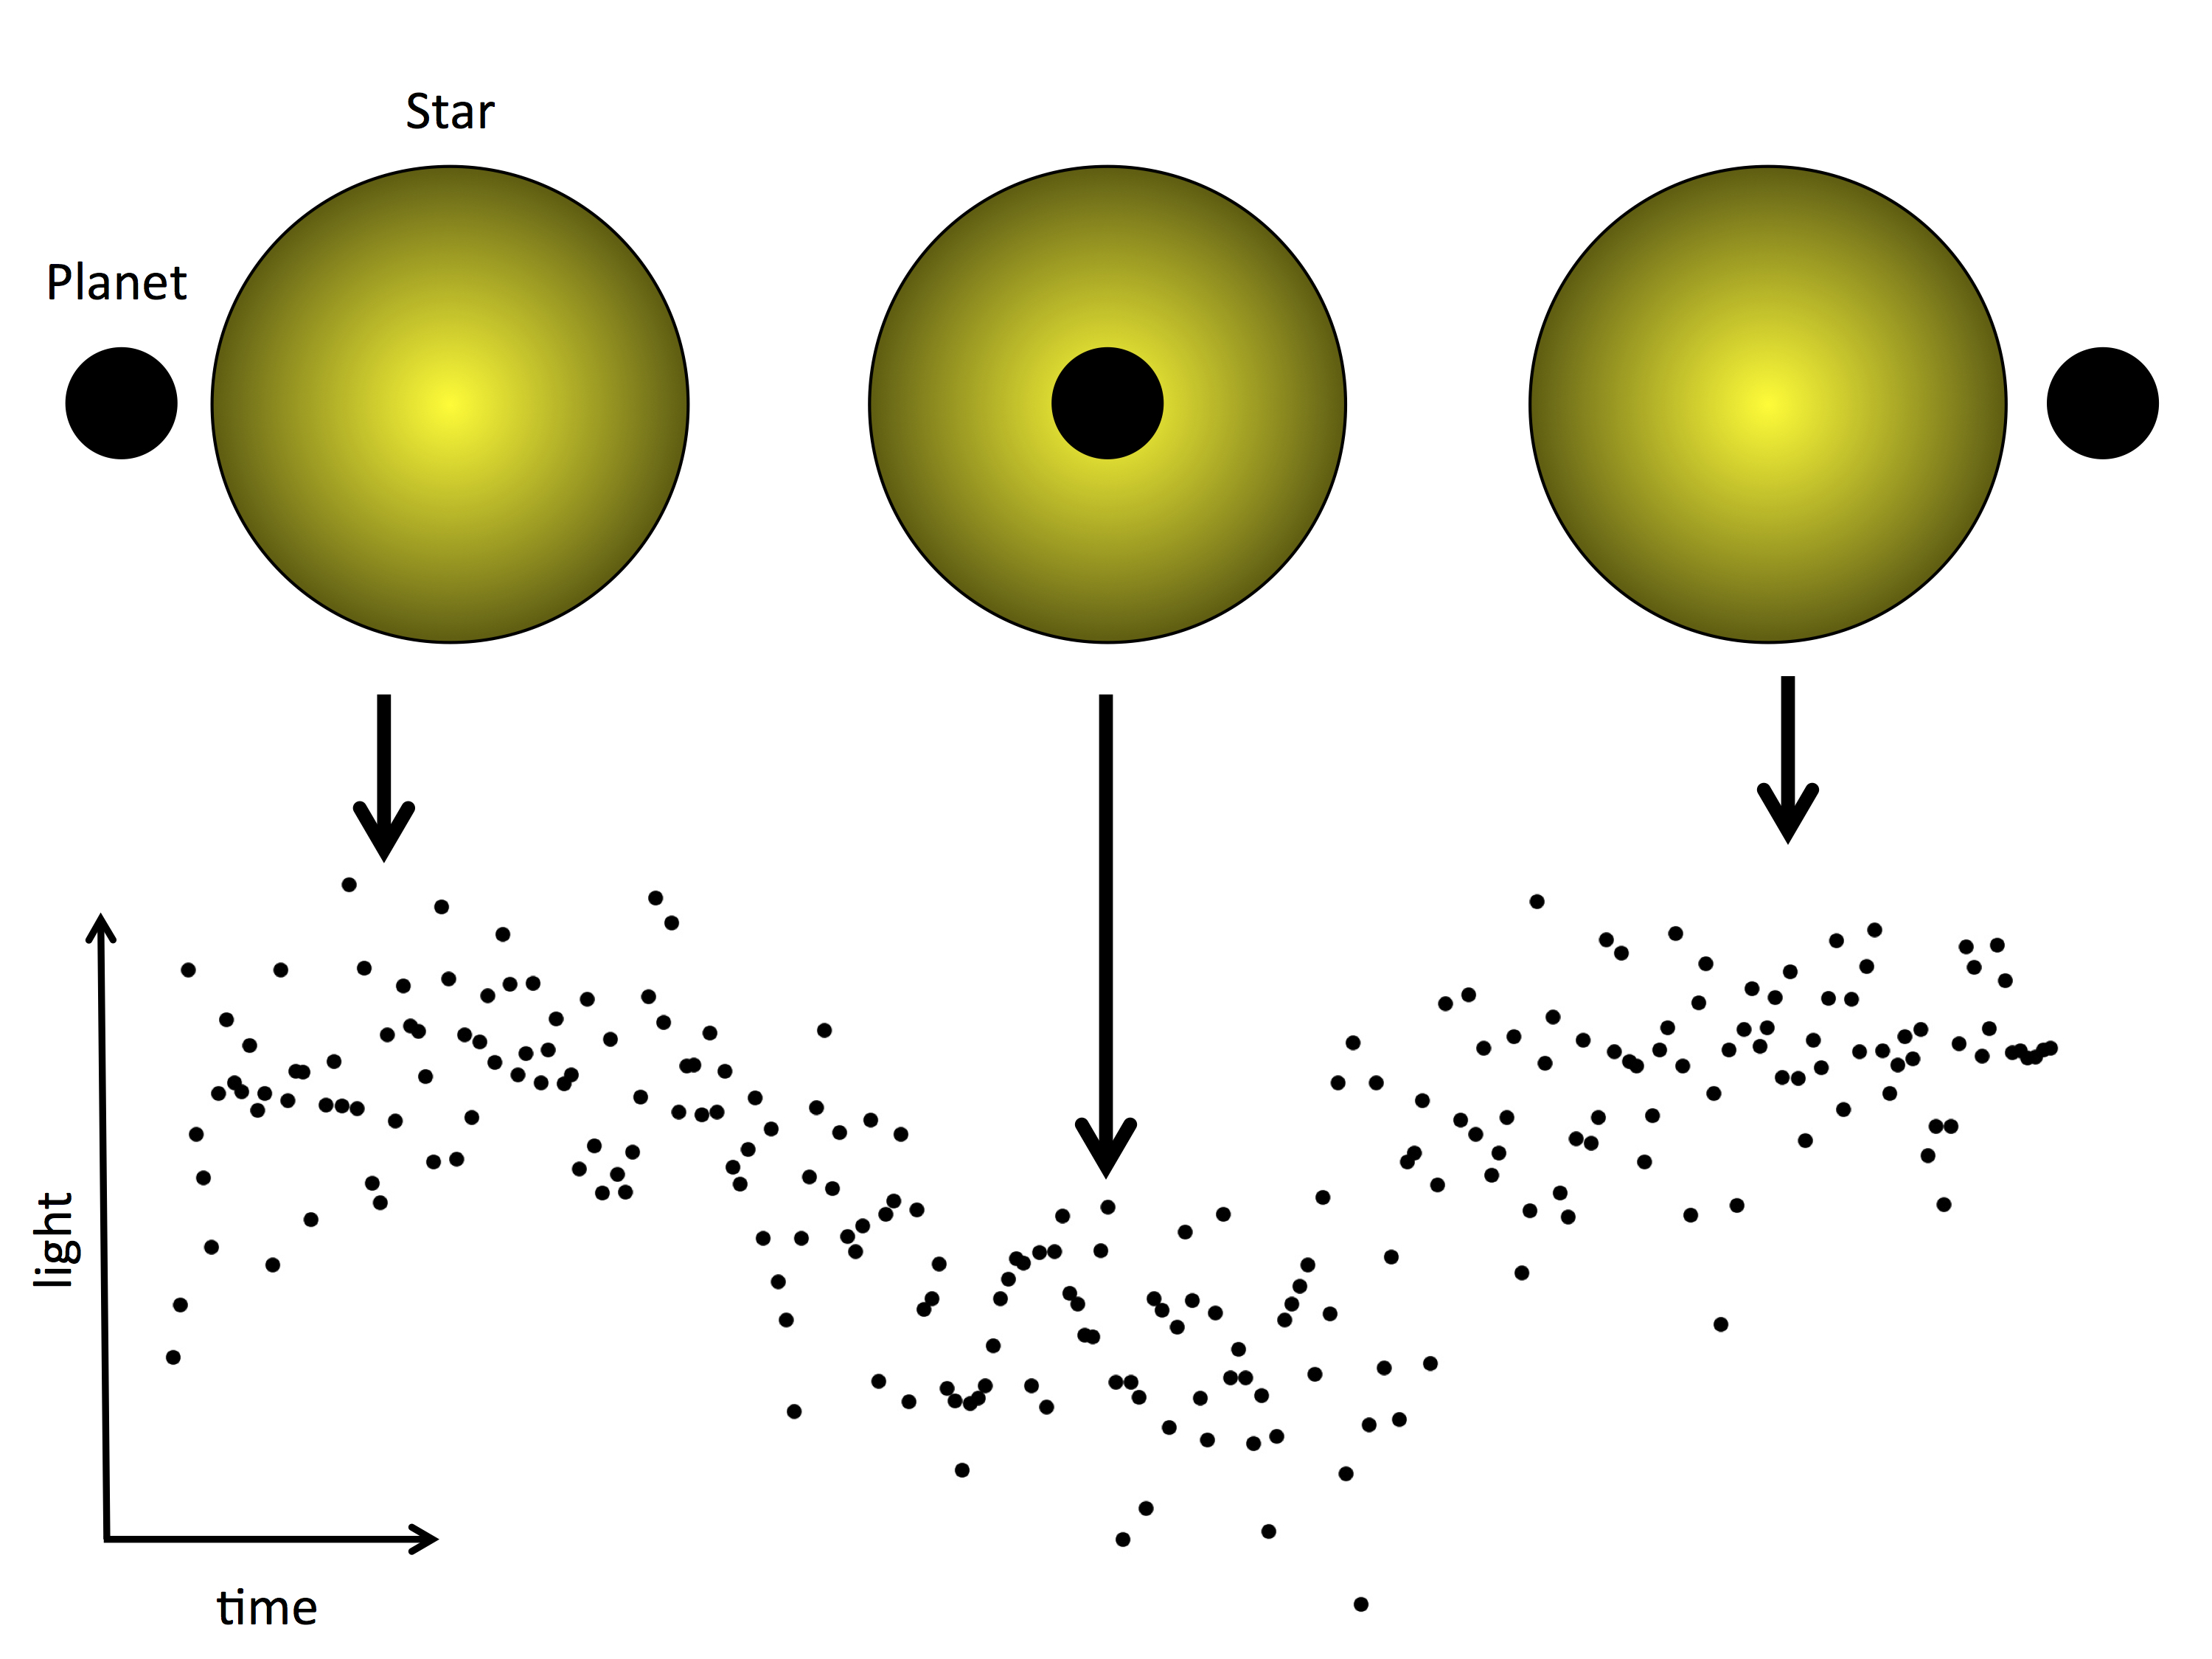
2. How does an exoplanet transit look like?
Well, we cannot see exoplanets but only the stars that host them! That is because exoplanets are far away and very small compared to their stars. However, when the exoplanet is passing in front of the star, the star's light is decreasing. The picture below shows the exoplanet passing its host star and the drop in the light of the star.

3. What kind of information can we exctract from such a plot?
The final outcome of the data analysis is the so called "lightcurve". The shape of the lightcurve is directly connected with the characteristics of the planet and its orbit. By comparing each lightcurve with a number of theoretical models, we can identify the best model that matches the data.The figure below depicts the lightcurve of the star WASP-10 while the exoplanet WASP-10b is transiting it.

In the near future, we will organise meetings and workshops for anyone who want to get trained and start analysing data. Stay tuned!
At the moment, you can find the instructions on how to install and how to use the software here.
In addition, a test dataset containing 6 Qatar-1b transits can be downloaded and analysed from here. These data have been analysed up to the alignment stage, but you can optionally analyse them from the beginning to familiarise yourself with the software. Send us the image with the final light-curve (set_1_detrended_model.pdf) alongside with the log.yaml file to our e-mail. We are looking forward to here your exoplanetary news!
